In the past, it was only possible to get execution run times in Apex test class methods by looking at the ApexTestResult object which represented the result of an Apex test method execution. Previously, information about limits and cumulative run time was available only by parsing the appropriate method sections in the debug log. Starting Summer 24, rows are now generated for Apex tests run with the @testSetup annotation. A new IsTestSetup column is set to true for these annotated tests to distinguish them from other test methods. Also, a new TestSetupTime column on ApexTestRunResult tracks the cumulative time of all setup methods for the given ApexTestRunResult, similar to how TestTime tracks the cumulative time of all its test methods. This was mentioned here as an idea at ideaexchange: Executing an Apex Test with @TestSetup annotation should generate ApexTestResult | IdeaExchange (salesforce.com)
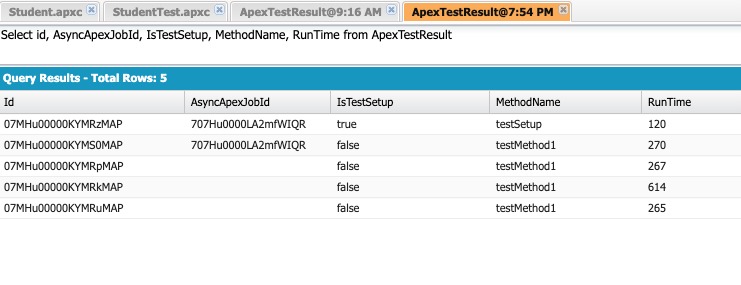
So after a test execution, you can now run a query like:
Select id, AsyncApexJobId, IsTestSetup, MethodName, Outcome, RunTime from ApexTestResult
ApexTestResult Represents the result of an Apex test method execution

Note the new IsTestSetup column along with the corresponding RunTime.
Running the following query and you will see summary information about all the test methods that were run in a particular Apex job as that is what ApexTestRunResult tracks.
SELECT Id, Source, AsyncApexJobId, MethodsCompleted, TestTime, TestSetupTime from ApexTestRunResult

This means that you can now benchmark Test Setup performance along with Test Methods. This can result in faster test class execution once you optimize the code. Happy refactoring 🙂
